

Credit Card Processing Series Part 2 of 3 - What You Are Really Paying, and to Whom
The three fee layers, the pricing models, and the cost gaps hiding in your statement
In Part 1, we followed a single sale through the system and met the players who each take a cut: the issuer, the acquirer, the network, and the processor. We ended on the one question that matters most to your bottom line, the gap between what your customer paid and what actually landed in your account. This article closes that gap.
When merchants talk about credit card fees, they usually lump everything together as one cost. In reality your total cost of acceptance is built from three distinct layers. Knowing which layer a charge belongs to tells you whether it is negotiable and who is collecting it.
The Three Layers of Every Fee

Layer One: Interchange Fees
Interchange is the largest component, typically making up the majority of your total cost. It is paid to the issuing bank, and it is set by the card networks, not by your processor. Neither you nor your processor can change interchange. It is the same baseline for everyone.
What makes interchange complicated is that there is not one rate. There are hundreds of categories. The rate on a given sale depends on the type of card (a basic rewards card costs less than a premium travel rewards card or a corporate card), the way the transaction is processed (a chip or tap in person costs less than a keyed in or online sale), and the kind of business you run, since networks publish different schedules for supermarkets, gas stations, restaurants, general retail, and e-commerce.
Interchange is usually expressed as a percentage of the sale plus a flat per transaction fee. The U.S. Government Accountability Office, in its review of card fees, found that total merchant costs of accepting cards have risen over time as card use has grown, driven in part by the networks adding more interchange categories and higher rates for premium cards.
The debit exception. Under the Durbin Amendment to the 2010 Dodd Frank Act, the Federal Reserve caps the interchange that large banks (those with $10 billion or more in assets) can charge on debit transactions. The cap is 21 cents plus 0.05 percent of the transaction value, plus a one cent fraud prevention adjustment for eligible issuers. This is why debit acceptance is generally far cheaper than credit, a difference we return to below.
Layer Two: Assessments and Network Fees
The second layer goes to the card networks themselves for the use of their infrastructure. These are smaller than interchange but still apply to every transaction. Mastercard's assessment on most sales, for example, is documented at 0.13 percent of the transaction, with an additional small acquirer license fee. Visa charges a comparable assessment. Like interchange, these are non negotiable and identical for everyone. They are the cost of being on the network at all.
Layer Three: The Processor's Markup
The third layer is the only part of your bill that your processor actually controls and the only part that is genuinely negotiable. This is the margin the processor adds on top of interchange and assessments to make its profit and cover its services. It can take the form of a percentage, a per transaction fee, monthly account fees, statement fees, batch fees, gateway fees, and a long list of other line items.
Because this layer is where the competition lives, it is also where merchants overpay the most. Two businesses with identical sales can pay very different effective rates depending entirely on the markup their processor charges and how transparently it is disclosed.
What to remember: The networks and issuers set Layers One and Two, and they are fixed for everyone. Layer Three is the part you are actually choosing, and the part worth scrutinizing.
What the National Numbers Reveal
The scale of these fees is enormous and growing. According to the Nilson Report, the most widely cited source on payment statistics, U.S. merchants paid $187.2 billion in card processing fees in 2024 to accept credit and debit cards, an increase of 8.7 percent over the prior year. By 2025 that figure had climbed to $198.25 billion.
The Nilson Report framed the average this way: for every $100 in card payments merchants accepted in 2024, they paid $1.57 in fees, a weighted average that has fluctuated between 1.45 and 1.57 percent over the prior decade. For credit cards specifically, the average swipe fee on Visa and Mastercard branded cards reached 2.35 percent of the transaction in 2024, up from 2.26 percent in 2023 and 2.02 percent in 2010. Visa and Mastercard control more than 80 percent of the credit card market, and each network centrally sets these rates for all the banks that issue cards under its brand.
These are not abstract figures. They represent the steady upward pressure on your margins that happens whether or not you are paying attention.
A Worked Example
To make the layers concrete, consider a single $100 credit card sale at a typical retail rate.
Now change one thing. Suppose the customer pays with a premium travel rewards card instead of a basic card. The interchange alone could rise well above $2, and your total cost climbs accordingly, even though nothing about your business or your effort changed. The customer earns the points, the issuer funds those points largely out of the higher interchange, and you absorb the difference. This is the dynamic at the heart of recent litigation over premium cards, and it is why the mix of cards your customers carry quietly shapes your average rate.
Notice also how the per transaction fee behaves. On a $100 sale, a 10-cent fee is trivial. On a $4 coffee, that same 10 cent fee is 2.5 percent of the sale all by itself, before any percentage-based fees are added. Businesses with small average tickets feel flat per item fees far more acutely, which is one reason the right pricing model depends heavily on what and how you sell.

Pricing Models: How Processors Package Your Fees
A processor cannot change interchange or assessments, but it has complete freedom in how it presents the bill to you. There are three common pricing structures, and the differences between them are where transparency, or the lack of it, lives.
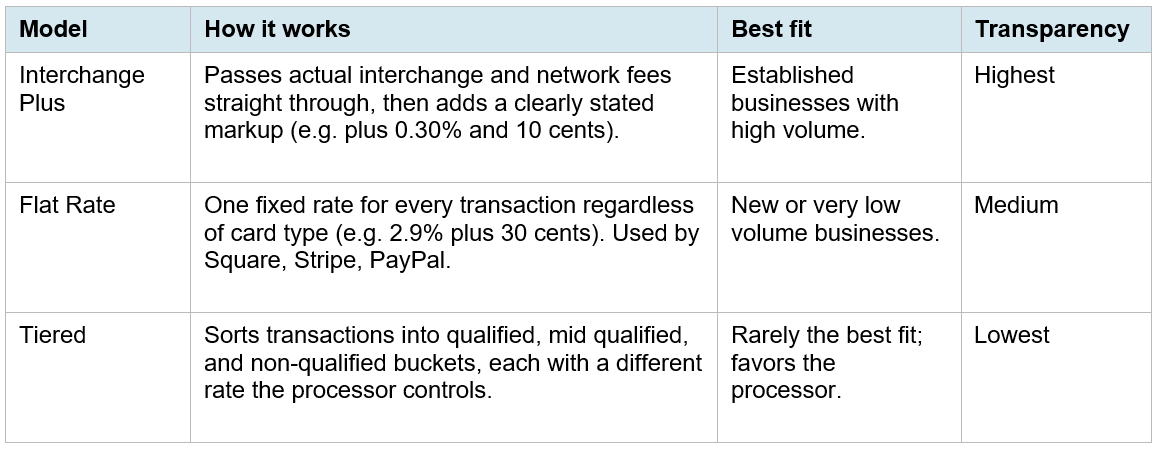
Flat rate looks simple, but the processor sets the rate high enough to protect itself against the most expensive cards, so on average you pay more per transaction than under interchange plus. Tiered pricing looks simple too, but the processor decides which transactions fall into which tier, and rewards cards, corporate cards, and keyed in transactions tend to get pushed into the higher cost buckets. Because the true interchange cost is hidden inside those buckets, tiered is frequently the most expensive model, and many merchants on tiered plans have no idea how much margin their processor is actually keeping.
The single most useful thing many business owners can do is find out which model they are on. If the answer is tiered, or if no one can give you a straight answer, that is a signal worth investigating.
Why Statements Are So Hard to Read
If you have ever stared at a merchant statement and felt lost, you are not alone, and it is not an accident. Statements often combine all three fee layers into blended line items, use abbreviations that are never defined, and bury small recurring charges that add up over a year.
Common line items that catch merchants off guard include:
• Monthly minimum fees, charged when you do not process enough volume
• Statement fees and batch fees, the latter applied each time you settle your daily transactions
• Gateway and terminal fees
• Annual fees that appear once a year and are easy to miss
• Charges with official sounding names like “regulatory product fee” that are simply additional processor margin
None of this is necessarily improper. The issue is that the complexity itself works against you. When a bill is impossible to decode, it is impossible to know whether you are being charged fairly. That information gap is exactly what an experienced advisor is built to close, the subject of Part 3.
Debit Versus Credit: A Cost Difference Worth Understanding
One of the most overlooked levers in a merchant's cost structure is the difference between debit and credit acceptance. They feel identical at the counter. Economically, they are not.
As noted above, the Durbin Amendment caps debit interchange for large issuing banks at 21 cents plus 0.05 percent of the transaction, plus a one cent fraud adjustment. Compare that to credit interchange that commonly runs from 1.5 to well over 2 percent with no per transaction cap of that kind. On a $100 sale, regulated debit interchange comes to roughly 27 cents, while credit interchange on the same sale can be ten times that or more.
The Nilson Report's 2024 figures reflect this gap at national scale. Merchants paid $148.52 billion to accept credit cards on $6.464 trillion of credit volume, while paying only $38.68 billion to accept debit and prepaid cards on $5.439 trillion of debit volume. Roughly comparable purchase volumes, but vastly different fee totals. Debit is simply far cheaper to accept.
Smaller issuing banks are exempt from the Durbin cap, so not all debit is equally cheap, and the routing of debit transactions across networks can affect cost. But the broad principle holds: encouraging debit where appropriate, and making sure debit transactions are routed and processed to capture the lowest available rates, can meaningfully lower your blended cost. This is technical territory, and one of the places where expert configuration earns its keep.
Card Not Present: Why Online and Phone Sales Cost More
Not every sale happens at a physical counter. E-commerce, phone orders, and any situation where the card is not physically read are known as card not present transactions, and they carry higher costs for a simple reason: more risk.
When a card is tapped or inserted in person, the chip and the physical presence of the card provide strong evidence the transaction is legitimate. When a number is keyed in or entered on a website, there is no such assurance, so the networks assign these transactions to higher interchange categories and the fraud liability often shifts toward the merchant. A keyed in sale at your terminal can cost noticeably more than the same sale tapped, even though the dollar amount is identical.
This matters for two reasons. First, merchants who occasionally key in card numbers out of habit, when a tap would have worked, are needlessly paying higher rates. Second, businesses that sell online need a secure payment gateway and appropriate fraud tools, both to qualify for the best available rates and to protect themselves from chargebacks. Configuring card not present acceptance correctly, capturing the right data fields and using the right security features, is another area where the difference between a well set up account and a careless one shows up directly on the statement.
Coming Up in Part 3
You now know what you pay and why. The final question is what to do about it. Part 3: Compliance, Your Rights, and How to Stop Overpaying covers your PCI obligations, the antitrust settlement that is actively reshaping merchant rights in 2026, surcharging rules, chargebacks, the exact questions to ask your processor, and where money quietly leaks out of independent businesses every month.